
In today’s world dominated by technology and gadgets, we often wonder how well a particular product or technology is being perceived by society and if it is truly going to leave a long lasting impression. We regularly see fan wars breaking out between Apple and Android fanatics (no offence to Windows mobile lovers!) on social media where each claim that they are better than the rest. Another thing we notice quite often is that whenever a new product is launched or in the process of being launched, it starts trending on different social media websites.
This made me wonder if there was a way to see some of these trends and the impact it is causing on social media. There are different social media channels where people post a wide variety of content ranging from personal opinions to videos and pictures. A few of the popular ones are listed below.
- YouTube
Today, I will discuss two such ways we can do this, namely Google Trendsand YouTube. If you want to know how we can perform data mining using Twitter, refer to my earlier post “Building a Twitter Sentiment Analysis App using R” which deals with getting data from Twitter and analyzing it.
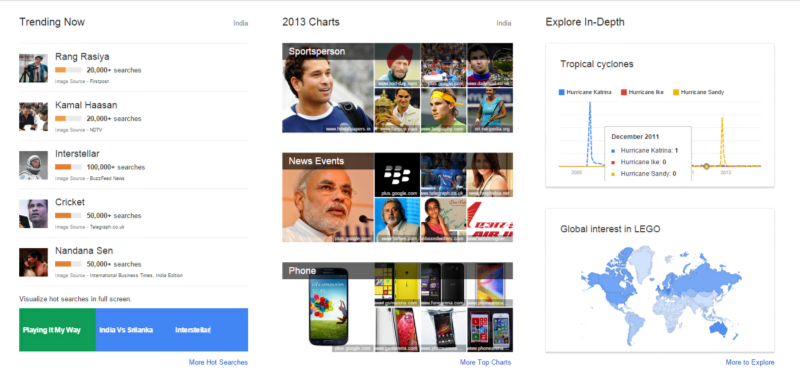
Now, we will be looking at how easy it is to visualize trending topics on Google Trends without writing a single line of code. For this, you need to go to the Google Trends website. On opening it, you will be greeted by an interactive dashboard, showing the current trending topics summarized briefly just like the snapshot shown below. You can also click on any particular panel to explore it in detail.
This is not all that Google Trends has to offer. We can also customize visualizations to see how specific topics are trending across the internet by specifying then in the interface and the results are shown in the form of a beautiful visualization. Google gets the data based on the number of times people have searched for it online. A typical comparison of people’s interest in different mobile operating systems over time is shown below.
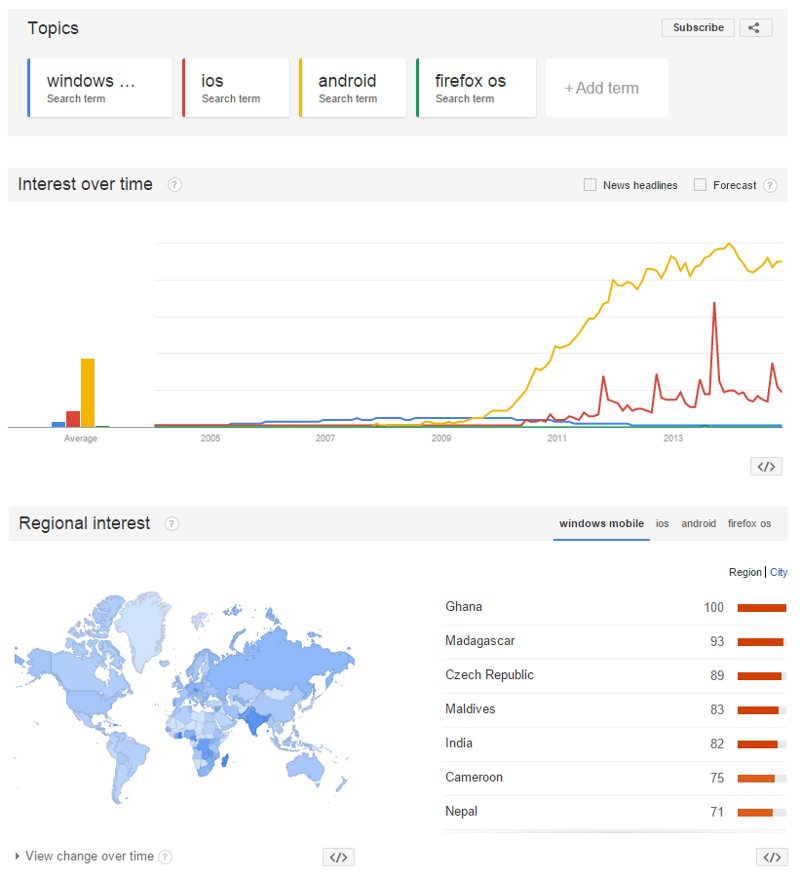
Interestingly, from the above visualization, we see that ‘Windows Mobile’ was quite popular from 2007 till mid 2009 when the popularity of ‘Android’ just skyrocketed. Apple’s ‘iOS’ gained popularity sometime around 2010. One must remember however that this data is purely based on data tracked by Google searches.
Coming to YouTube, it is perhaps the most popular video sharing website and I am sure all of you have at least watched a video on YouTube. Interestingly, we can also get a lot of interesting statistics from these videos besides just watching them, thanks to some great APIs provided by Google.
In the next part, I will discuss how to get interesting statistics from YouTube based on a search keyword and do some basic analysis. I won’t be delving into the depths of data analytics here but I will provide you enough information to get started with data mining from YouTube. We will be using Google’s YouTube Data API, some Python wrappers for the same and the pandasframework to analyze the data.
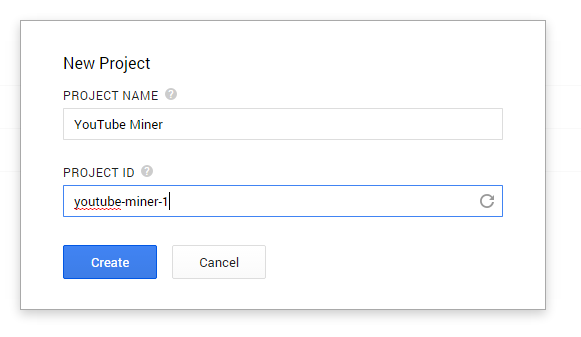
First, we would need to go to the Google Developers Console and create a new project just like the snapshot shown below.
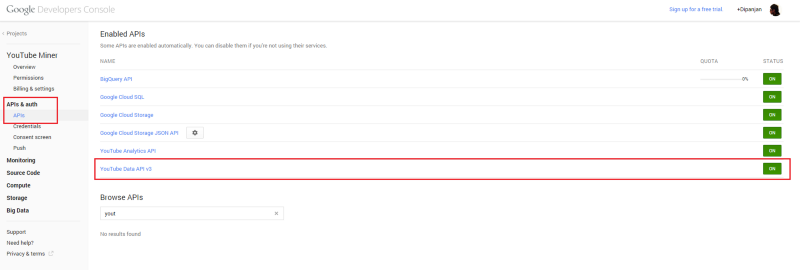
Once the project is created, you will be automatically re-directed to the dashboard for the project: There you can choose to enable the APIs you want for your application. Go to the APIs section on the left and enable the YouTube Data API v3 just like it is depicted in the snapshot below (click it if you are unable to make out the text in the image).
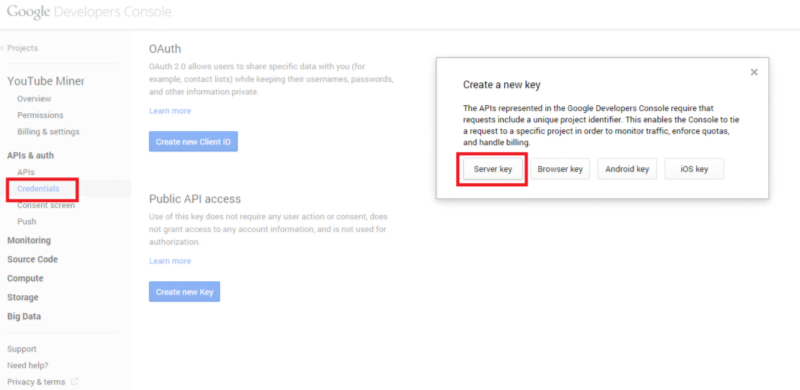
Now, we will create a new API key for public API access. For this, go to the Credentials section and click on Create new key and choose the Server key option and create a new API key which is shown in the snapshot below (click to zoom the image).
We will be using some Python libraries so open up your terminal or command prompt and install the following necessary libraries if you don’t have them.
[root@dip]# pip install google-api-python-client [root@dip]# pip install pandas
Now that the initial setup is complete, we can start writing some code! Head over to your favorite Python IDE or console and use the following code segment to build a YouTube resource object.
from apiclient.discovery import build from apiclient.errors import HttpError import pandas as pd DEVELOPER_KEY = "REPLACE WITH YOUR KEY" YOUTUBE_API_SERVICE_NAME = "youtube" YOUTUBE_API_VERSION = "v3" youtube = build(YOUTUBE_API_SERVICE_NAME, YOUTUBE_API_VERSION, developerKey=DEVELOPER_KEY)
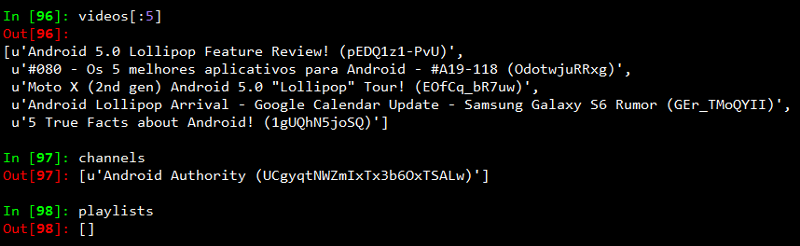
Once this is complete, we will be using this YouTube resource object to search for videos with the android keyword. For this we will be using the search method to query YouTube and after getting back a list of results, we will be storing each result to its appropriate list, and then display the lists of matching videos, channels, and playlists using the following code segment.
search_response = youtube.search().list( q="android", part="id,snippet", maxResults=50 ).execute() videos = [] channels = [] playlists = [] for search_result in search_response.get("items", []): if search_result["id"]["kind"] == "youtube#video": videos.append("%s (%s)" % (search_result["snippet"]["title"], search_result["id"]["videoId"])) elif search_result["id"]["kind"] == "youtube#channel": channels.append("%s (%s)" % (search_result["snippet"]["title"], search_result["id"]["channelId"])) elif search_result["id"]["kind"] == "youtube#playlist": playlists.append("%s (%s)" % (search_result["snippet"]["title"], search_result["id"]["playlistId"]))
Based on the query I ran, most of the results seemed to be videos. The output I obtained is shown in the snapshot below.
Since the playlists and channels we obtained are very less in number, I decided to go ahead and analyze the videos obtained. For that, we create a dict of video identifiers and video names. Then we pass a query to the YouTube API’s videos method, to get the relevant statistics for each video.
videos = {} for search_result in search_response.get("items", []): if search_result["id"]["kind"] == "youtube#video": videos[search_result["id"]["videoId"]] = search_result["snippet"]["title"] video_ids_list = ','.join(videos.keys()) video_list_stats = youtube.videos().list( id=video_ids_list, part='id,statistics' ).execute()
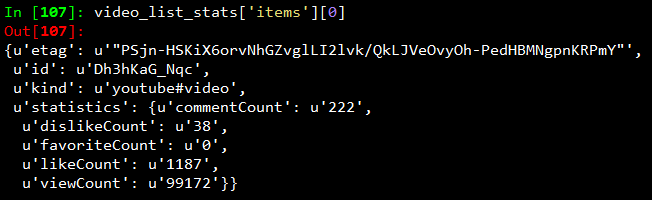
I know you must be interested by now to see what kind of data is present in video_list_stats. So for that, I will show you the relevant statistics obtained for a video from the API in the following snapshot.
Now we will be using pandas to analyze this data. For that, the following code segment is used, to get this data into a pandas data frame.
df = [] for item in videos_list_stats['items']: video_dict = dict(video_id = item['id'], video_title = videos[item['id']]) video_dict.update(item['statistics']) df.append(video_dict) df = pd.DataFrame.from_dict(df)
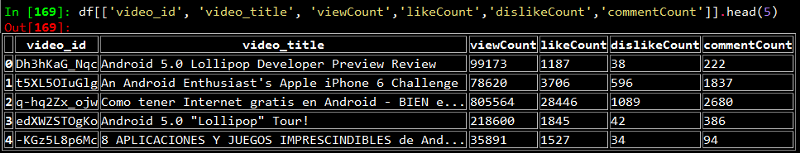
Now, we can view the contents of this data frame. I will be showing the output of the first few rows with the relevant columns in the snapshot below. I have considered only the important data points which include viewCount, likeCount, dislikeCount, commentCount indicating the number of views, likes, dislikes and comments on the videos respectively.
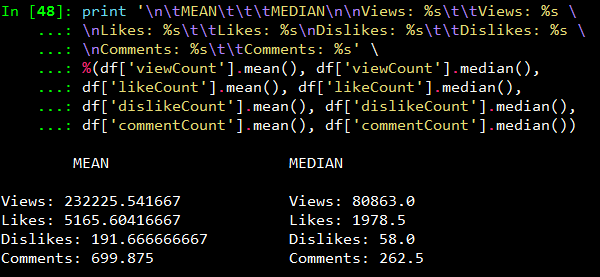
Once we have this table of clean and formatted data, we can do all sorts of analytics on it, like getting the mean and median for number of views, seeing which are really popular videos and so on. Some examples with required code segments are depicted below. I have used the IPython shell for analyzing the data.
Mean and Median of different counts
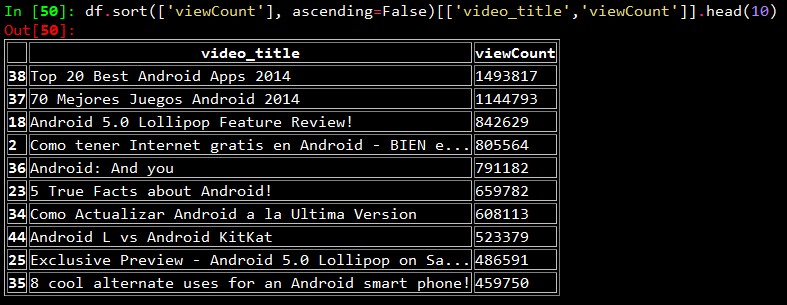
Top ten most viewed videos
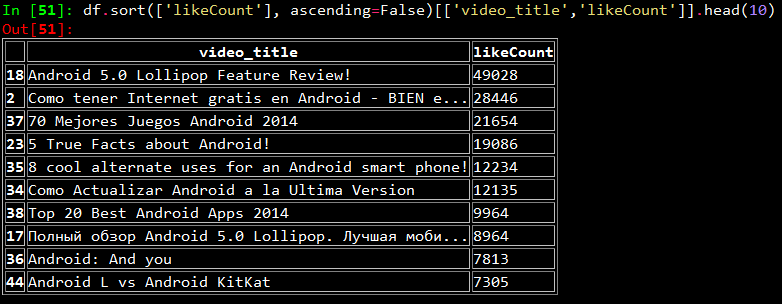
Top ten most liked videos
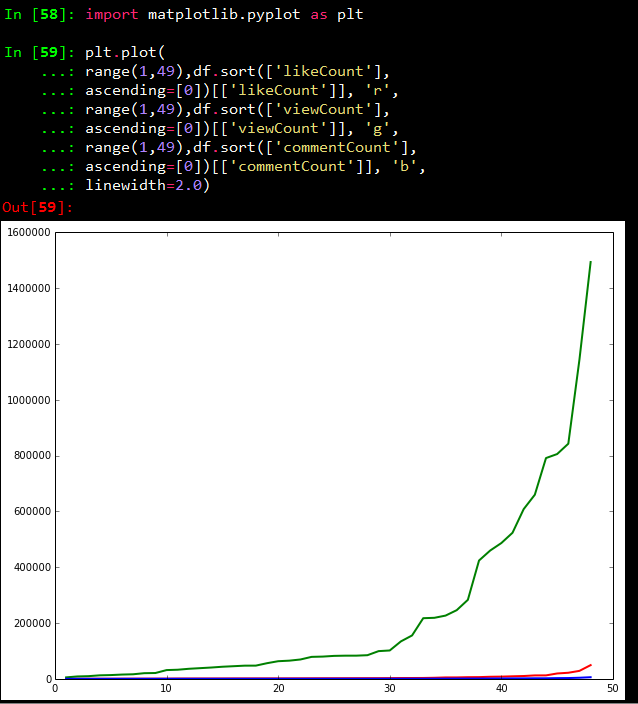
Line chart showing counts of likes, views and comments
Thus you can see by now that a lot of interesting analysis and visualizations can be built on top of this data. For more details on how to customize and use the Youtube API with Python, you can refer to this page for sample code segments.
Originally published at blog.dataweave.in.
Thank you for Subscribing - Team DataWeave
Book a Demo
Login
For accounts configured with Google ID, use Google login on top. For accounts using SSO Services, use the button marked "Single Sign-on".